Creating the UI is a complicated job. Moreover, to make analytic ui, required sensitivity in making display that can reveal important data.
Today I’d like to show you some examples of analytics chart ui for your inspiration. Use these analytics ui for inspiration on parts of your UI design. Want to learn or hone your skills in the UI design? Then check out these analytics chart ui design, where you’ll find tons of advice and inspiration. Visit the source to see each project in full.
Table of Contents
Analytics Chart by Chun-Chuan Lin

Some Analytics
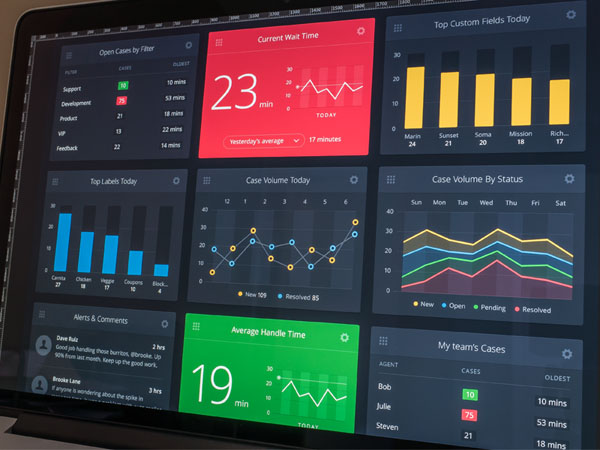
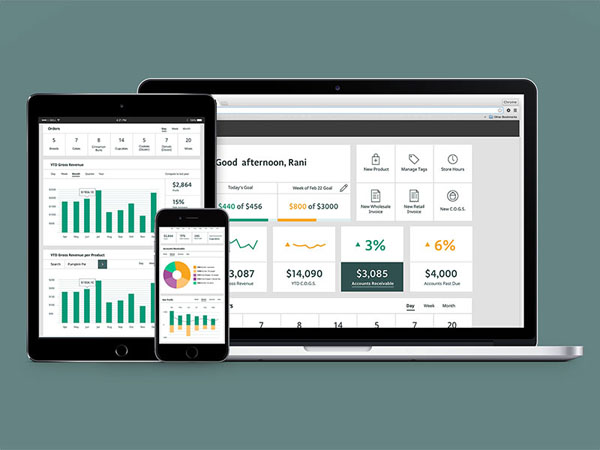
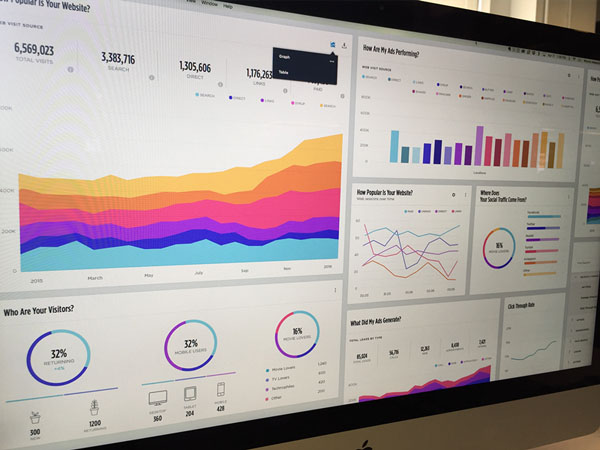
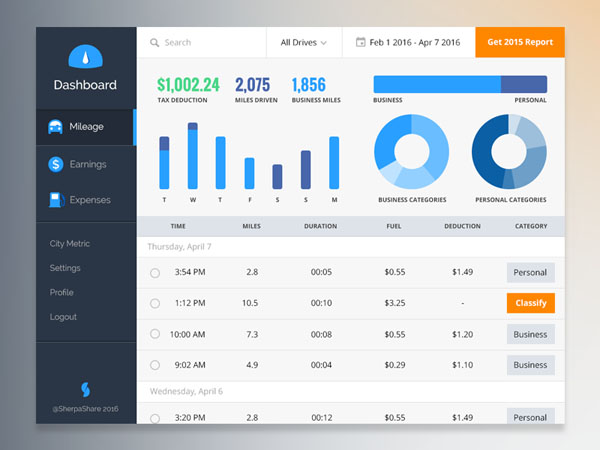
Desk Dashboard
Xonom

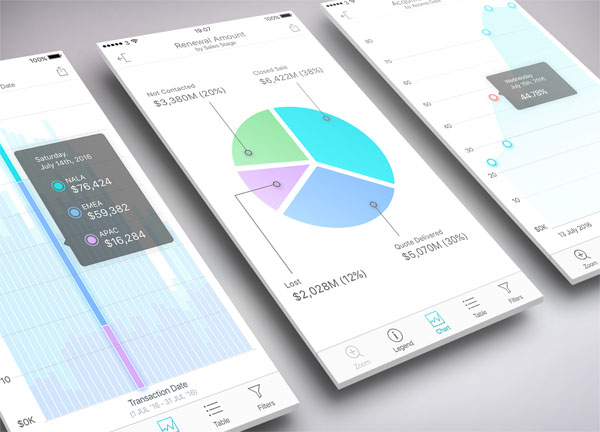
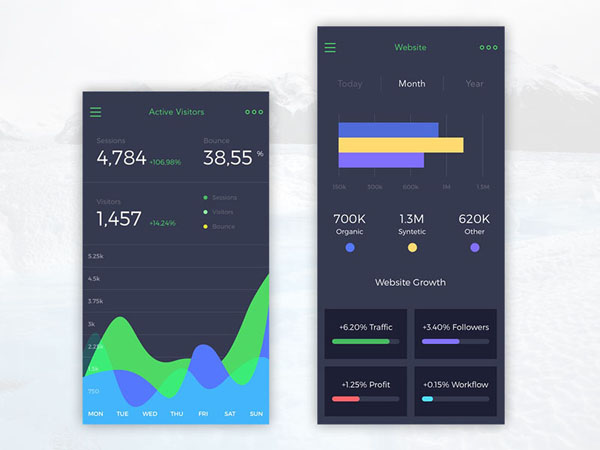
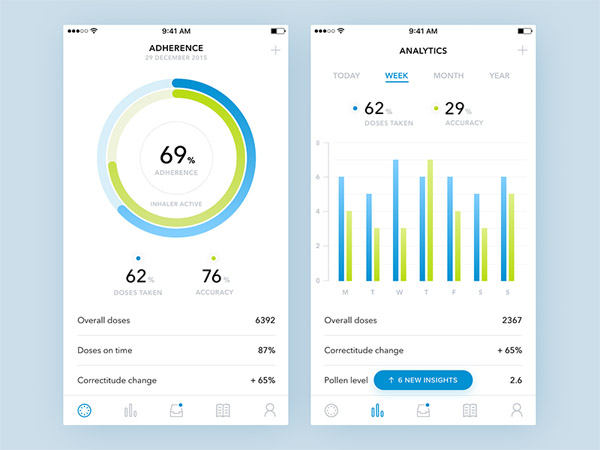
Mobile Analytics

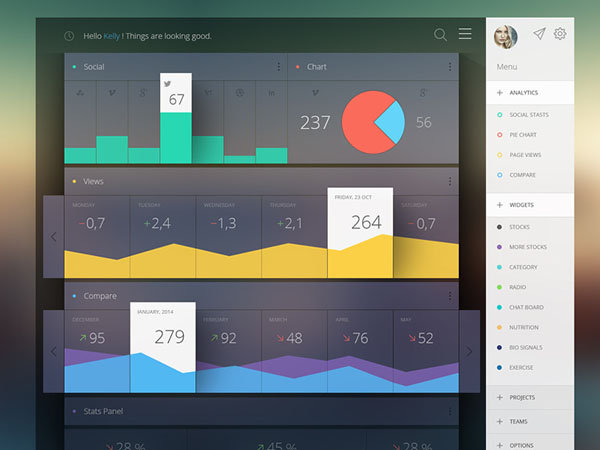
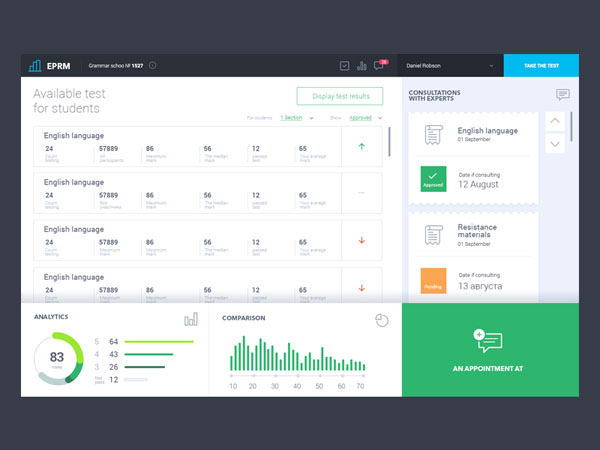
Dashboard Web App
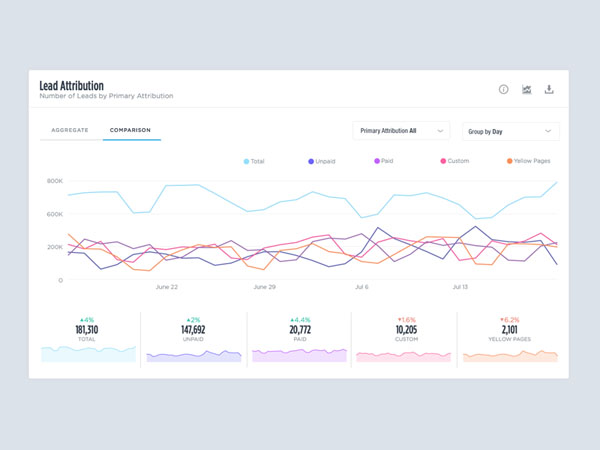
Analytics Reporting

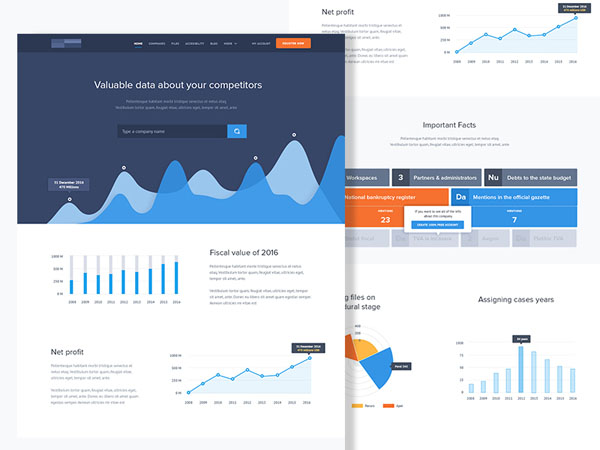
Analytics Landing Page
Dashboard Design
Broker Market Dashboard

Responsive Analytics Dashboard
Aggregate Exploded Over Time
Dashboard
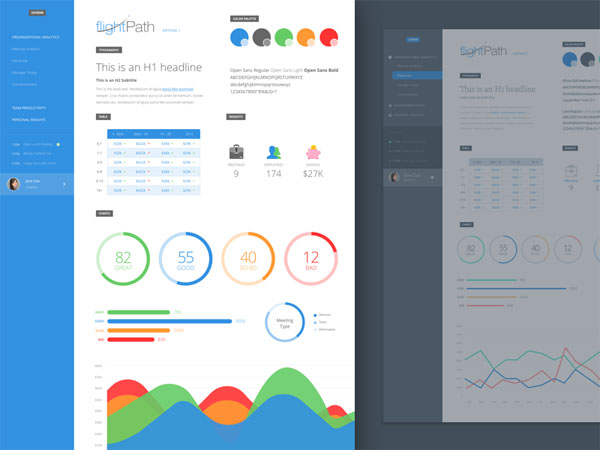
Style Tiles
Sunset Dashboard
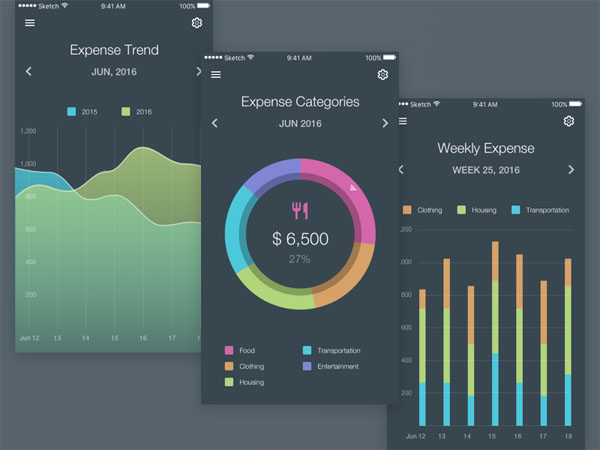
Analytics app screens
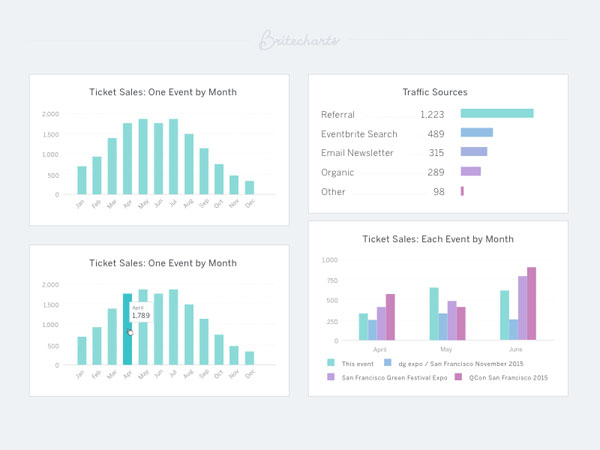
Bar Chart
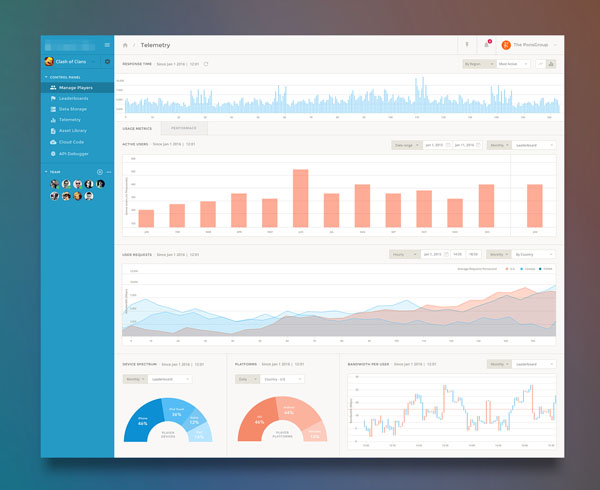
Web App Dashboard
Dashboard Design
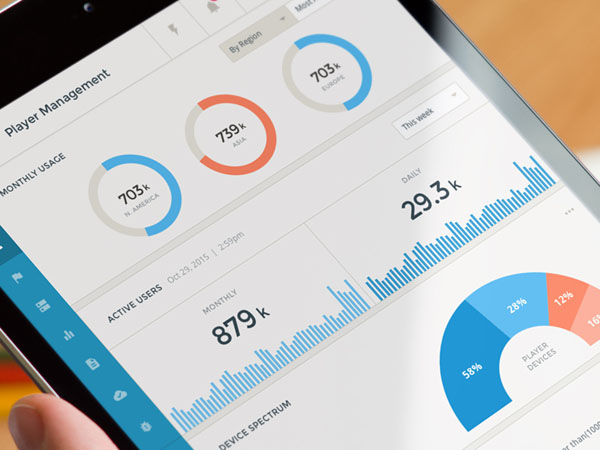
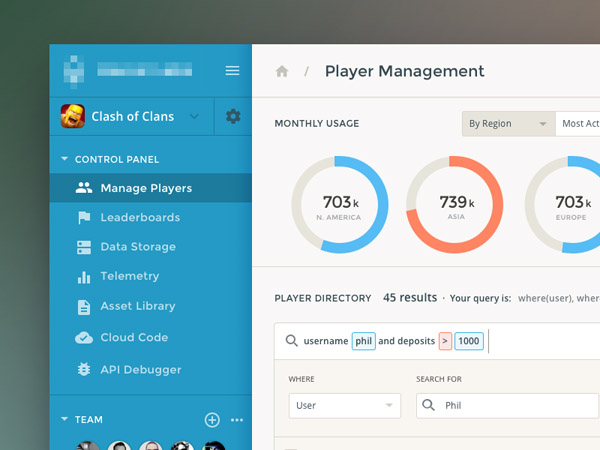
Player Dashboard UI
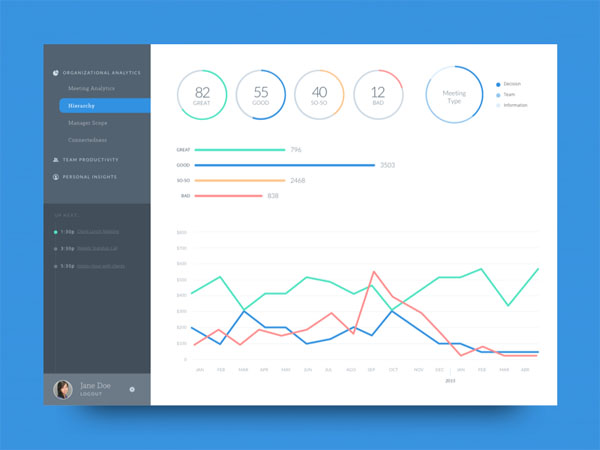
Objective Performance

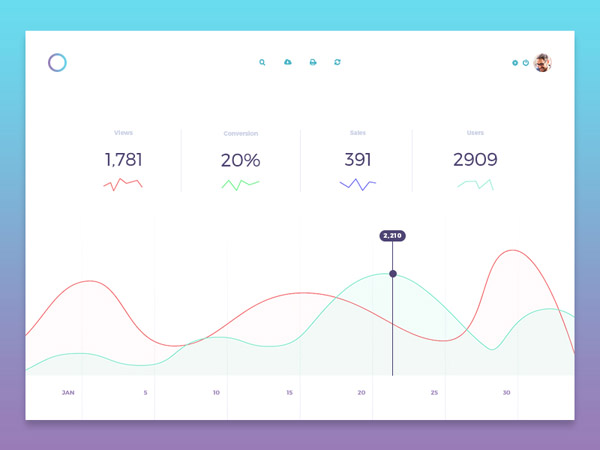
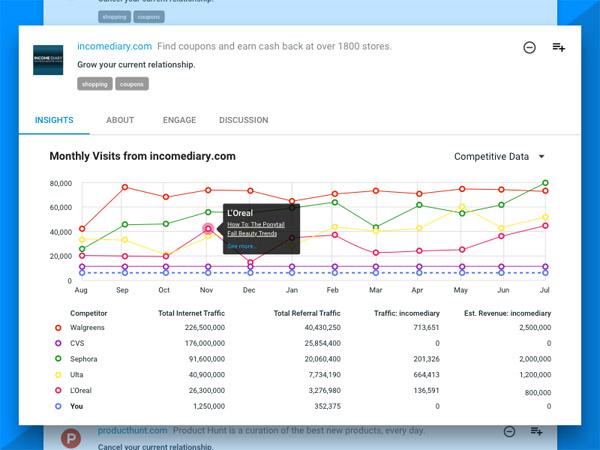
Analytics Chart
Insights
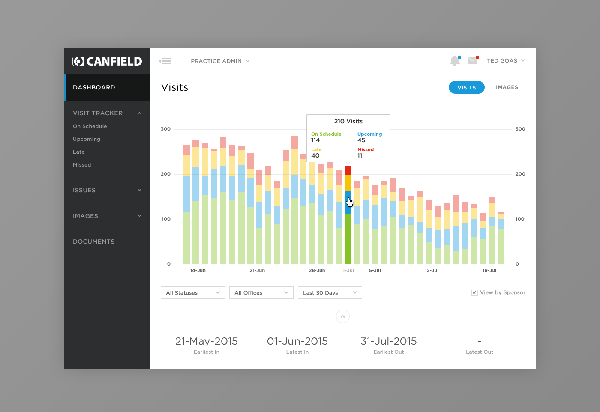
Clinical Dashboard

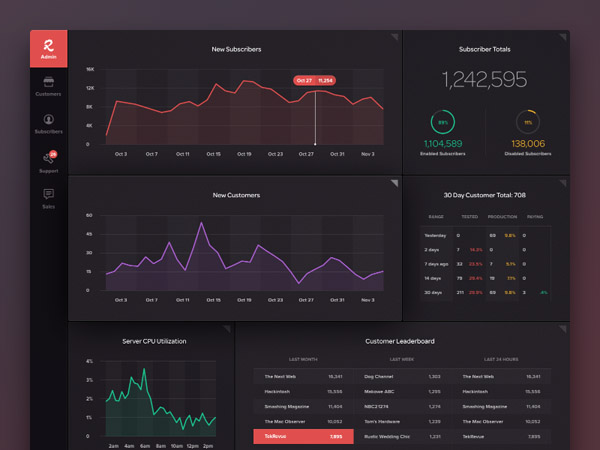
Roost Admin Dash
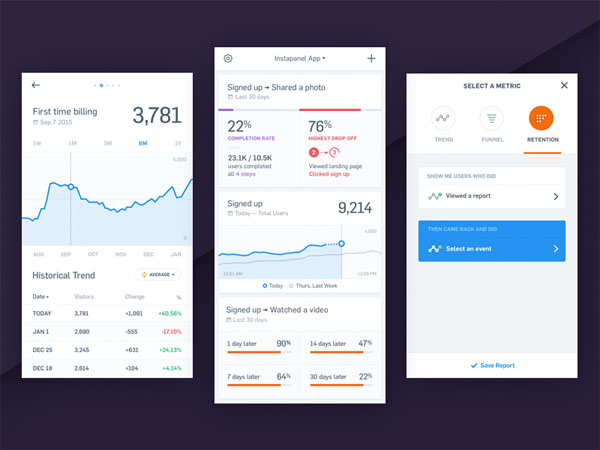
Mixpanel iOS, iPhone App
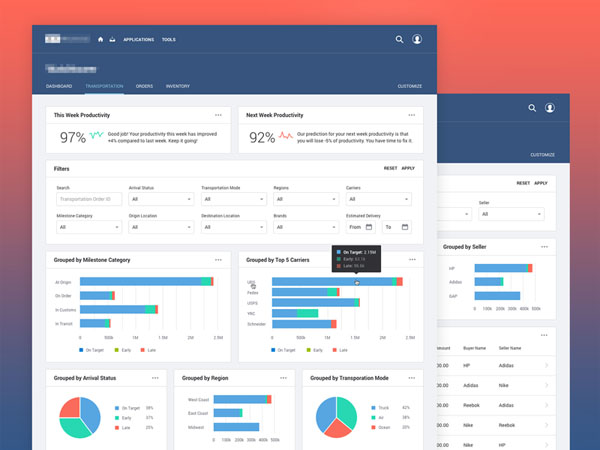
Supply Chain App
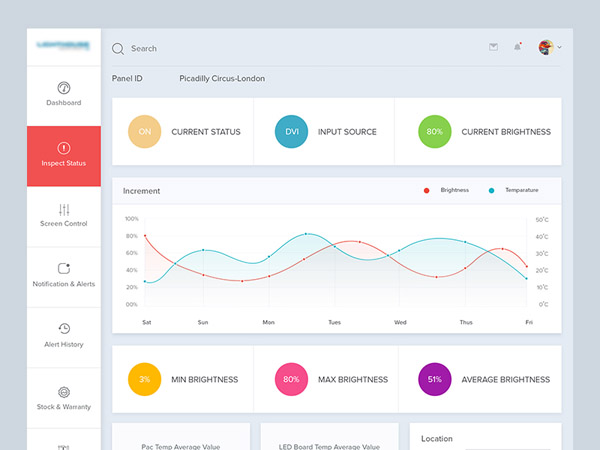
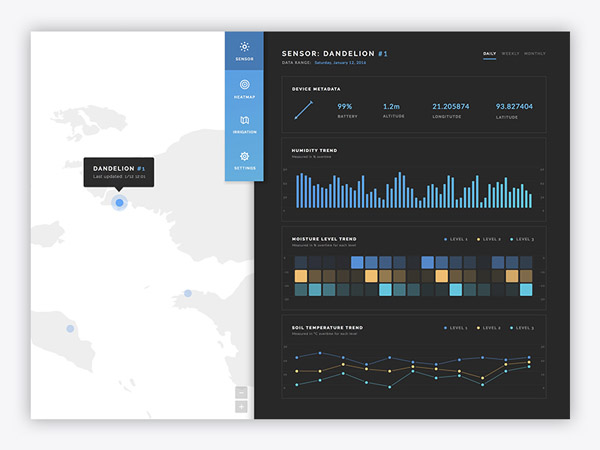
Sensor Historical Data
Medical Analytics
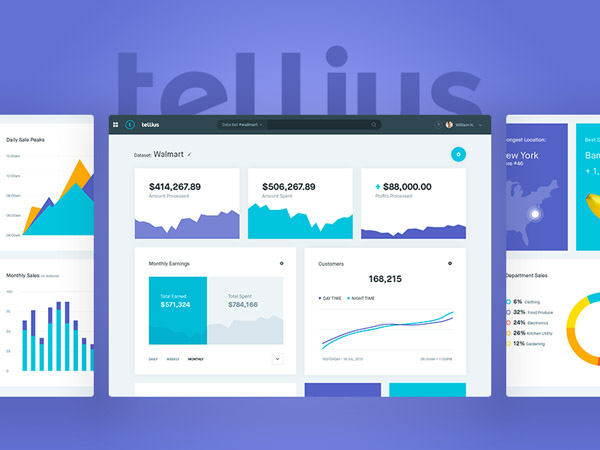
Tellius UI
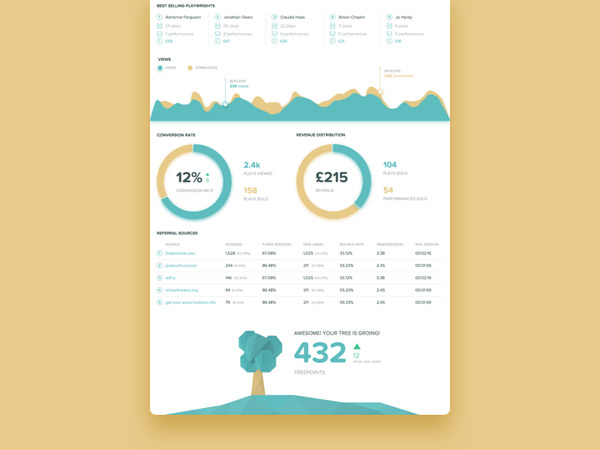
TreePress
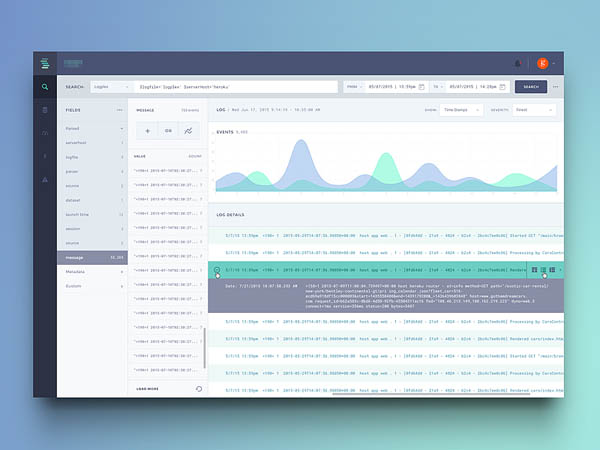
Log Management Dashboard
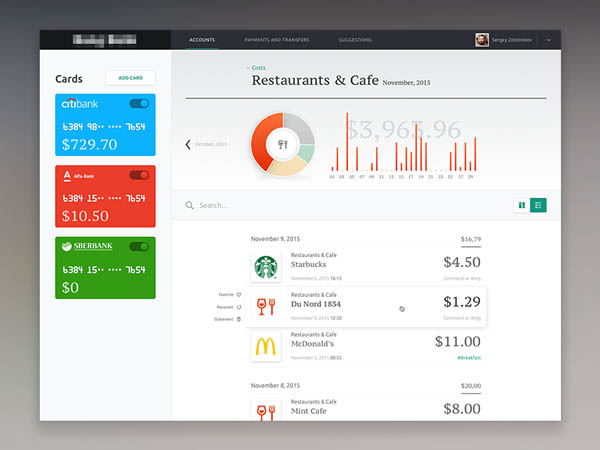
Internet Banking