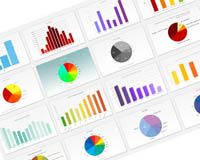
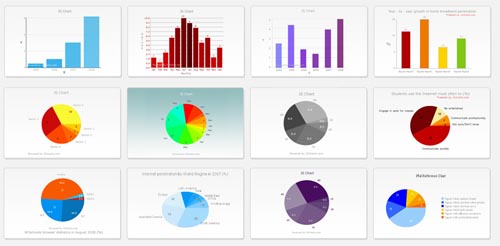
jQuery is the most popular JavaScript library in use today. It is a fast and concise JavaScript Library that simplifies HTML document traversing, event handling, animating, and Ajax interactions for rapid web development. It also can be use to make Graphical Chart in your web page. Here are some great jQuery Graph and Chart plugins just for you.
See also:
- 13 jQuery Shopping Cart Plugin and Tutorial
- Convert HTML Forms to Ajax Forms with Alajax jquery Plugin
- 15 Best Free HTML5 Video Players
- 14 Free Mobile WordPress Themes and Plugin
- 7 Useful jQuery Weather Plugin
- 15 Best Open Source Ecommerce CMS
- 38 Best Premium Cloud and Forecast Icons Set
Table of Contents
1. JS Charts
JS Charts is a JavaScript based chart generator that requires little or no coding. With JS Charts drawing charts is a simple and easy task, since you only have to use client-side scripting.
2. Flot
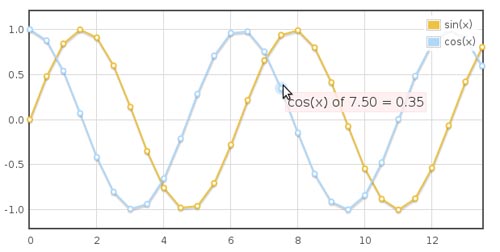
Flot is a pure Javascript plotting library for jQuery. It produces graphical plots of arbitrary datasets on-the-fly client-side.
3. jQuery Sparklines
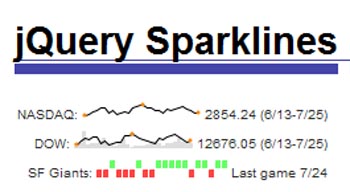
This jQuery plugin generates sparklines (small inline charts) directly in the browser using data supplied either inline in the HTML, or via javascript. The plugin is compatible with most modern browsers and has been tested with Firefox 2+, Safari 3+, Opera 9, Google Chrome and Internet Explorer 6, 7, 8 & 9 as well as iOS and Android.
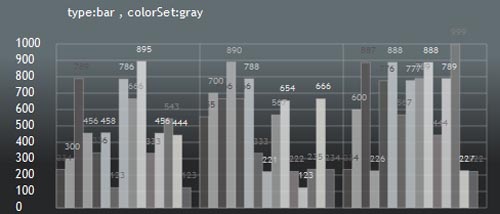
4. jQchart + CanvasGradient
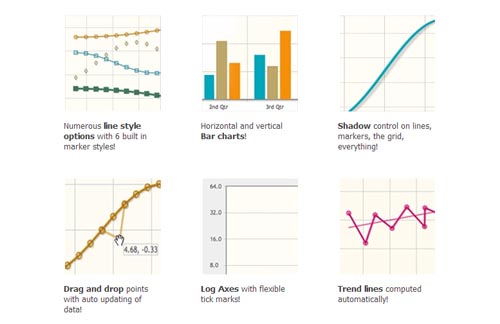
5. jqplot
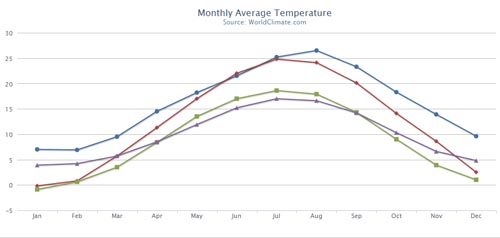
6. Highcharts
7. Canvas 3D Graph
Canvas 3D Graph is a special type of bar graph that plot numbers in 3D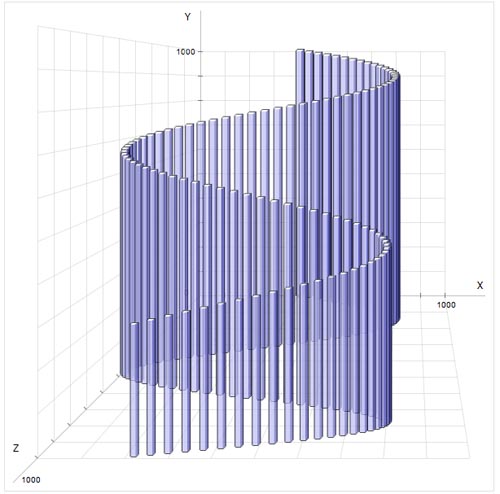 8. TufteGraph
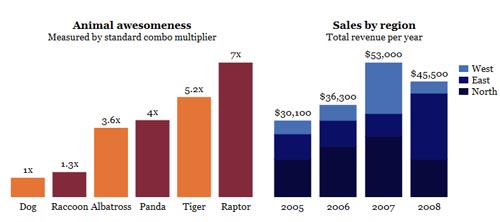
a jQuery plugin that makes pretty bar charts.
9. GraphUp – jQuery Plugin
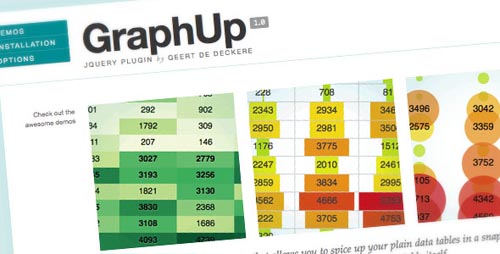
GraphUp is a very flexible and lightweight jQuery (v1.4+) plugin to spice up your data tables. It visualizes the values using color, bar charts and bubbles.
10. Graphix
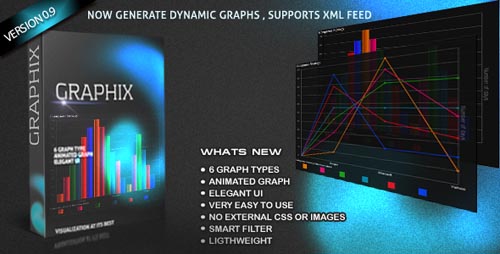
Graphix is a powerful graph and chart plugin which produces beautiful and stunning looking graphs. It offers an animated UI with a very easy to interface.
11. jQuery Visualize
HTML5 canvas charts driven by HTML table elements
12. PlotKit
PlotKit is a Chart and Graph Plotting Library for Javascript. It has support for HTML Canvas and also SVG via Adobe SVG Viewer and native browser support.

